
Augmented Reality with JavaScript, part two
Last time, if you remember, I was playing around with some augmented reality. In particular, investigating what can be achieved without involving a lot of native, platform-specific coding (and all of the issues of divergent codebases that go along with that if we want our application to reach multiple platforms).
Naturally, the first port of call was the browser. I went through an approach combining three.js and the JSARToolkit. Whilst I still maintain it’s pretty amazing that you can do stuff like this in the browser, the desktop doesn’t really provide for the augmented reality experience I was hoping for[1]. I didn’t just want to see the augmented image reflected back to me on my monitor. I wanted to look onto the scene and experience the magic of seeing the augmentation appear in front of my very eyes (albeit, while looking through the camera lens of some mobile device)!
Surely that’s going to require some native coding! Am I going to have to write the app in Java if I want it to run on Android devices, and then write it all again in Objective-C for Apple devices?
Well, Wikitude provide Android and iOS SDKs for building augmented reality applications. They also have a PhoneGap extension so, in theory, we could use this to write our application in HTML, CSS and JavaScript, then re-use the same code for each platform. You do need to have a development environment set up for each platform in order to build it though[2].
In the rest of this post, I’ll go through how I created AR Molecule, an Android app that uses PhoneGap and the Wikitude SDK to provide augmented reality with our 3D caffeine molecule.
Here’s just a short (poor quality) video to give some idea of what it looks like…
I haven’t tested it, but all of the code here should be equally as applicable to an iOS app using the iOS version of the SDK.
Setting up the project
You need to make a developer’s account at Wikitude to download and use the SDK. It’s free to register and you get a fully functional version which is free to use for trial purposes. You need to purchase a license to remove the “Trial” watermark and distribute the app, but that’s not necessary for this demonstration.
Follow these steps to set up the project:
- Download the PhoneGap plugin extension
- Set up a PhoneGap Android project[3]
- Follow the setup guide here to add the Wikitude SDK to your project
- Set
<uses-sdk android:minSdkVersion="8"/>or higher inAndroidManifest.xml - Add the permissions listed here to your
AndroidManifest.xml
Now, to make sure that’s all set up correctly, try building and running the project, (ideally on a hardware device rather than an emulator because you’re going to need to be able to do that to test the augmented reality features later). You should see the default PhoneGap start screen…

Entering the Augmented Reality world
With Wikitude an Augmented Reality world (ARchitectWorld) is a bit like a web page in that it is written in HTML and JavaScript, but that’s where the similarity ends. Any HTML content is displayed on top of the device’s camera view and it can call methods in Wikitude’s AR module to render augmented reality content. It also makes use of compass and accelerometer values.
To turn a standard web page into an ARchitectWorld you only have to include architect://architect.js. So, add a new file, theWorld.html, to the assets/www folder in the project you just created and give it the following HTML…
<!DOCTYPE html>
<html>
  <head>
    <meta http-equiv="Content-Type" content="text/html; charset=UTF-8" />
    <title>Hello Wikitude</title>
  </head>
  <body>
    <script src="architect://architect.js"></script>
  </body>
</html>
…then load the ARchitectWorld in your deviceready handler. There should already be a deviceready function in a file called assets/www/js/index.js. (This file and the code that’s already in it was created when setting up the PhoneGap project in the previous section.) Add the following code to the deviceready function…
// isDeviceSupported to check the device has the required hardware and software.
WikitudePlugin.isDeviceSupported(function() {
  // Success callback - load the ARchitectWorld with the path to your world's HTML file
  WikitudePlugin.loadARchitectWorld("assets/www/theWorld.html");
},

function() {
  // Error callback - the device isn't supported :-(
  navigator.notification.alert('Unable to launch the AR world on this device!');
});
So now, when you launch the app, you’ll see an empty AR world. (Actually, you’re seeing our theWorld.html web page displayed on top of the camera view. You can prove that to yourself, if you want, by adding some text or any other HTML elements to the body of theWorld.html and you’ll see them displayed over the camera view.)
Of course, an AR world without any augmentation looks a lot like the plain old boring real world so let’s see what we can do about that…
Image recognition and some simple augmentation
Unlike JSARToolkit, Wikitude lets you create your own marker images. This opens up a lot of possibilities. Instead of having to use those black and white block images you could augment your business card, company logo, magazine advert, etc. Some images work better than others though. When you create the marker, Wikitude will give it a star rating (0-3) to give some indication of how suitable the image is for tracking. They also have some hints and tips on this page on what does and doesn’t make a good marker image.
I tried (and failed) to be a bit creative and made this marker image…

(I got the background image from freestock.ca under a Creative Commons Attribution 3.0 Unported License. The image of the caffeine structure came from Wikipedia.)
To make your own image into a marker follow these instructions from Wikitude. Download your target collection (.wtc file) and add it to the assets/www/res folder in your project. (If you prefer, you can download my wtc file from the github repository.)
Now we’ll try adding a simple text label overlay just to see how it works.
First, add a new JavaScript file to the project and include it in theWorld.html. (I put mine in the assets/www/js folder and called it theWorld.js)…
<body>
  <script src="architect://architect.js"></script>
  <script src="js/theWorld.js"></script>
</body>
Then put this code in the new JavaScript file…
// Construct the AR.Tracker with the path to your wtc file
var tracker = new AR.Tracker("res/caffeine.wtc");
// The second parameter is the height of the label in SDUs
// You can read about SDUs here...
// ...http://www.wikitude.com/external/doc/documentation/3.0/Reference/JavaScript%20Reference/module_AR.html
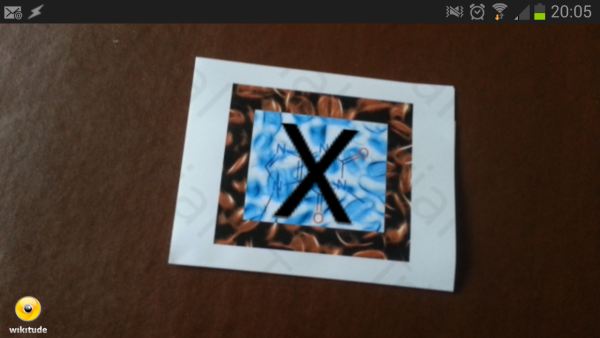
var overlay = new AR.Label("X", 1);
new AR.Trackable2DObject(tracker, "target", {drawables: {cam: overlay}});…and see what happens when you run it on your device and point it at a print out of your marker. Hopefully, you’ll see something like this…
3D
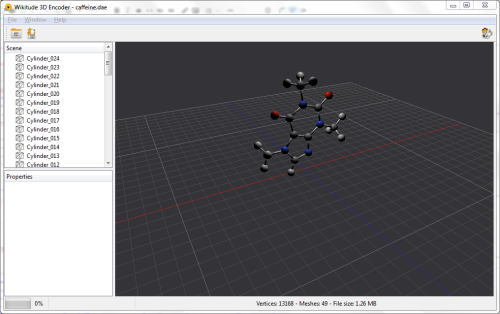
To incorporate 3D content into your AR world you need to convert it into Wikitude’s own format. That’s actually fairly straightforward to do with the Wikitude 3D Encoder. It just means we need to create the 3D content and convert it separately - we can’t create it programmatically like we did with the threejs and JSARToolkit example.
The Wikitude 3D Encoder accepts models in FBX (.fbx) or Collada (.dae) file formats. I think most 3D modelling tools can export to at least one of these formats. There are also plenty of websites where you can download (sometimes for free) 3D models in either format.
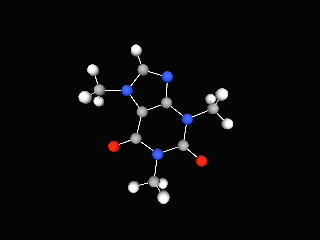
I used Blender (a free and open source 3D creation software) to create a copy of my caffeine molecule[4]. Blender has exports for both FBX and Collada files.
It’s then just a case of opening the .fbx or .dae file in the Wikitude 3D encoder and using the export button to save it to the Wikitude format (.wt3).
I seemed to have more success with Collada dae files. From reading the Wikitude forums it sounds like it could be a bug in the way Blender exports the lighting information in FBX format.
Either way, the Wikitude 3D Encoder seems to do a good job of displaying the model as it will appear in your AR World, so if it doesn’t look right here there’s probably no point trying it on the device either.
To include the model in your AR World export from the Wikitude Encoder, add the exported .wt3 file to the project, load it into an AR.Model object and pass this into the AR.Trackable2DObject instead of the label from the previous example. You can also scale the object, if necessary, to fit on to your marker better…
var model = new AR.Model("res/caffeine.wt3", {
  scale: { x: 0.1, y: 0.1, z: 0.1 }
});

new AR.Trackable2DObject(tracker, "target", {drawables: {cam: model}});
Animation
The last thing I wanted to add in is some animation. Wikitude provides a set of classes for animating any numeric property of any object.
There are limitations to using these with 3D models though. The animation will be applied on the complete loaded model scene. For example, if you use it to spin a model that’s lit from one side then you’ll see the dark side and light side as it rotates[5].
Having said that, let’s add a spinning animation to our model just to demonstrate how it can be done. I kind of get away with it with this model because it is lit from directly above - on the axis of the rotation.
First, we create an AR.PropertyAnimation passing it the object we want to animate and the name of the property to animate. The next three values specify the animation’s start value, end value and duration in milliseconds. Finally, we specify a linear easing curve for a simple constant rotation.
When we start the animation with a call to the start function we can pass in the number of times we want the animation to loop, or, -1 indicates infinite looping.
var spinAnimation = new AR.PropertyAnimation(model, "rotate.roll",
0, 360, 10000, {type: AR.CONST.EASING_CURVE_TYPE.LINEAR});

var tracker = new AR.Tracker("res/caffeine.wtc", {
  onLoaded : function() {
    spinAnimation.start(-1);
  }
});
And that’s it. If you run it on your device now you should see the 3D spinning molecule appear whenever you point the device at the marker image.
The complete code is available on GitHub. Note that you will still need to register and download the Wikitude SDK to build it.
1. ...and mobile browsers don't yet are only just starting to support the experimental features that my three.js/JSARToolkit implementation relies on.
2. Although PhoneGap Build now has support for user submitted plugins, I'm not sure if Wikitude will be making their SDK available as part of that. My guess is that they'll want to keep access to the SDK through registration on their website only.
3. HINT: Don't have spaces in the path to your source code directory. I learned the hard way that the cordova utility used for setting up the project doesn't like that.
4. I also found a nice tutorial using Blender's Python API to create 3D molecules so I was able to use that to make something similar to my three.js model.
5. The latest version of the SDK provides support for handling models containing animations, i.e., where the animation has been defined in the modelling software and exported in the FBX or Collada file. If you know how to create these animations in the modelling software then this is probably the better option.
Augmented Reality with JavaScript, part one
A colleague from marketing came back from a motor show recently with some augmented reality promotional material from one of the vendors. When they suggested that we make something similar for the conferences we attend I took it as a personal challenge!
You know the sort of thing - the company hands out fliers together with a link to a mobile app. The flier by itself looks quite plain and boring. But if you install the app on your phone or tablet and look at the flier through the device’s camera, then it suddenly springs to life with 3D models and animations. Here’s an example…
They can be very effective and engaging, but surely to implement something like this requires lots of platform specific SDKs and native coding, resulting in quite different codebases for the different types of devices you want to support? Well, it turns out that’s not necessarily true…
In this post I’ll go through a first attempt at doing some augmented reality in the browser (yes - you heard right…augmented reality in the browser) using three.js and JSARToolkit. Then, in the second part I’ll go through an alternative using PhoneGap with the wikitude plug-in to produce something more suited to mobile devices, (but still primarily using JavaScript and HTML).
A first attempt with JSARToolkit and three.js
I’d already been playing around with three.js and used it to create some 3D chemical structures. I’m sure you recognise this caffeine molecule - you may even have it printed on your coffee mug…
…so this seemed like a reasonable candidate to try pairing up with some augmented reality.
JSARToolkit is a JavaScript port of a Flash port of a Java port of an augmented reality library written in C called ARToolkit. (Did you follow that? …never mind, it’s not important!).
To use it you give it a <canvas> element containing an image. The toolkit analyses this image for known markers. It will then provide you with information about the markers it detected, including their transform matrices. You can see an example below. The image used as input to the toolkit is on the left and the results of its image analysis on the right.
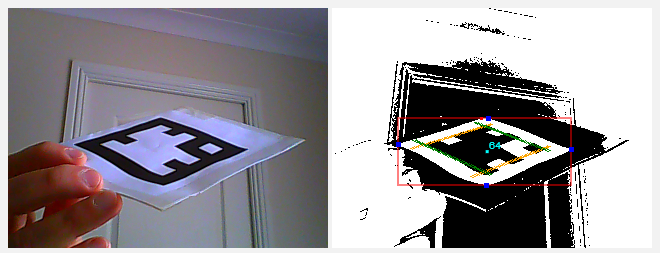
TIP: While working with the toolkit you can add a canvas to your page with
id="debugCanvas"and defineDEBUG = truein your JavaScript. The toolkit will then use this canvas to display debug information from its image analysis, as shown in the above right image.
You then use this information to ‘augment’ the original image…
- Get the transform matrix from a detected marker and apply it to your three.js object
- Draw the input image into your three.js scene
- Overlay your transformed object
The main thing you need to know is how to convert the toolkit’s matrices into something that three.js understands. There are two transforms you need to apply…
- The three.js camera that you use for rendering the scene needs to have the same projection matrix as the detector, and,
- The three.js object that you want to line up with a marker needs to have the same transform matrix as the marker.
I must confess that my understanding of 3D transform matrices is sketchy,[1] but I was able to use the demonstration in this article to make a couple of helper functions to convert the matrices to the appropriate three.js form.
Use this for setting the three.js camera projection matrix from the JSARToolkit’s detector…
THREE.Camera.prototype.setJsArMatrix = function (jsArParameters) {
  var matrixArray = new Float32Array(16);
  jsArParameters.copyCameraMatrix(matrixArray, 10, 10000);

  return this.projectionMatrix.set(
    matrixArray[0], matrixArray[4], matrixArray[8],  matrixArray[12],
    matrixArray[1], matrixArray[5], matrixArray[9],  matrixArray[13],
    matrixArray[2], matrixArray[6], matrixArray[10], matrixArray[14],
    matrixArray[3], matrixArray[7], matrixArray[11], matrixArray[15]
  );
};
Here’s an example of how you use it…
// The JSARToolkit detector...
var parameters = new FLARParam(width, height);
var detector = new FLARMultiIdMarkerDetector(parameters, markerWidth);

// The three.js camera for rendering the overlay on the input images
// (We need to give it the same projection matrix as the detector
// so the overlay will line up with what the detector is 'seeing')
var overlayCamera = new THREE.Camera();
overlayCamera.setJsArMatrix(parameters);
And, to set the three.js object transform matrix from a marker detected by the toolkit…
THREE.Object3D.prototype.setJsArMatrix = function (jsArMatrix) {
  return this.matrix.set(
     jsArMatrix.m00,  jsArMatrix.m01, -jsArMatrix.m02,  jsArMatrix.m03,
    -jsArMatrix.m10, -jsArMatrix.m11,  jsArMatrix.m12, -jsArMatrix.m13,
     jsArMatrix.m20,  jsArMatrix.m21, -jsArMatrix.m22,  jsArMatrix.m23,
                  0,               0,               0,               1
  );
};
…with an example of its usage:
// This JSARToolkit object reads image data from the canvas 'inputCapture'...
var imageReader = new NyARRgbRaster_Canvas2D(inputCapture);

// ...and we'll store matrix information about the detected markers here.
var resultMatrix = new NyARTransMatResult();

// Use the imageReader to detect the markers
// (The 2nd parameter is a threshold)
if (detector.detectMarkerLite(imageReader, 128) > 0) {
  // If any markers were detected, get the transform matrix of the first one
  detector.getTransformMatrix(0, resultMatrix);

  // and use it to transform our three.js object
  molecule.setJsArMatrix(resultMatrix);
  molecule.matrixWorldNeedsUpdate = true;
}

// Render the scene (input image first then overlay the transformed molecule)
...
Now, imagine putting that in an animation loop, and using the WebRTC API to update the inputCapture canvas on each frame from the user’s webcam video stream, and you’ve pretty much got real-time streaming augmented reality!
You can see how I’ve put it all together in [this code here] (http://molecules3d.apphb.com/scripts/AR_mediastream.js) (or, view the full project on GitHub).
If you can use WebGL and WebRTC then you can print out this marker…

…and try it out.
Ok, so it is a bit rough and I’ve clearly still got some work to do but I still find it pretty impressive that you can even do anything like this in the browser! There is one obvious drawback with this approach though…It’s all very well holding up a marker to your webcam and seeing the augmented image reflected back to you, but it’s not really the same experience as looking at the scene ‘through’ your mobile device and seeing the augmentation appear on your ‘line of sight’. Unfortunately, mobile browsers don’t support the experimental features that this relies on…(yet?)
As I mentioned at the start of the post, PhoneGap with the wikitude plug-in provides an alternative more suited to mobile devices, (but still primarily using JavaScript and HTML). I’ll go through some of that next time. (I’m trying to get out of the habit of writing ridiculously long blog posts!) But, if you can’t wait, the code for an Android version is here on GitHub.
1. There's some good information in this stackoverflow answer, but I think I'm going to have to read it a couple more times to get it to sink in!
Real-time analysis of streaming audio data with Web Audio API
Web Audio API is a high-level JavaScript API for processing and synthesizing audio in web applications. The aim of the API is to enable things like dynamic sound effects in games, sound processing in music production applications, and real-time analysis in music visualisers.
Music visualisers create and render animations synchronised to changes in the music’s properties (frequency, loudness, etc). Most media players (such as Windows Media Player, or iTunes) have some sort of music visualiser feature…
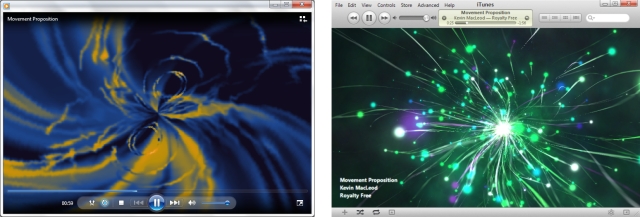
Creating this type of visualisation in the browser was only really practical by pre-processing the audio up-front and storing information separately to be accessed by the visualiser during playback. But that was before the Web Audio API and its real-time analysis capabilities…
The API is currently a working draft so things can change at any time. However, there is partial support in Chrome (as long as we use a webkit prefix),[1] which means we can start to have a play around and investigate its features. In this post we’ll begin to investigate the real-time analysis capabilities of the API. (Obviously, there’s a whole lot more to the API that we won’t even touch on here!)
If you’ve got a supported browser you should be able to see it in action here with a very basic music visualizer that runs in the browser without the restriction of having to pre-process each piece of music in advance.
Music: Movement Proposition, Kevin MacLeod (incompetech.com)
Unable to run this Web Audio API example. Check browser support
The rest of this post will introduce some of the basic concepts of the Web Audio API and outline the implementation of the above animation. If you prefer, just dive straight in to the source code here.
Audio routing graphs
The API is based around the concept of audio routing graphs. At its simplest, an audio routing graph will consist of a single sound source (such as the audio data in an MP3 file) connected directly to a sound destination (such as your computer’s speakers).

In general, the routing can contain any number of ‘nodes’ connected between one or more sound sources and ultimately connecting to the destination (what you get to hear). Audio data is passed in to each of the nodes, manipulated in some way and output to the next connection.
Using the API basically comes down to creating different types of nodes (some for controlling various properties of the audio, some for adding effects, etc, etc) and defining how the nodes should be connected together. As you can imagine, this can allow much more complex and powerful routing than the simple connection shown above. The routing we’ll be using to access the real-time analysis of the audio is very straightforward though, as you’ll see later.
The AudioContext
The AudioContext object is the main abstraction used for creating sound sources, creating the audio manipulation nodes, and defining the connections between them.
var context = new webkitAudioContext();
  // (Remember the 'webkit' prefix we mentioned earlier?)
So, let’s see how we could use this to create that simple source-to-destination routing we showed earlier.
First, we need the sound source. One way to create a sound source is to load the audio from an MP3 file into memory using an XMLHttpRequest. In the code below we’ve used the AudioContext’s createBufferSource to create the source node. Then we use the context’s createBuffer function to convert the ArrayBuffer response from the request into an AudioBuffer, and use that to set the source’s buffer property…
var request = new XMLHttpRequest();
request.open("GET", urlToMp3File, true);
request.responseType = "arraybuffer";

request.onload = function() {
    var source = context.createBufferSource();
    source.buffer = context.createBuffer(request.response, false);
}

request.send();
We don’t have to create the destination node. The AudioContext has a destination property which represents the final destination to the audio hardware. We simply create the routing by connecting our source object to the AudioContext’s destination.
source.connect(context.destination);
A streaming sound source
The buffer approach described above is fine for short audio clips, but for longer sounds we wouldn’t want to wait for the full data to be loaded into memory! It is, however, really easy to get streaming audio input as a sound source in an audio routing graph. To do this we use an <audio> HTML element…
<audio id="player" src="urlToMp3"></audio>The <audio> element represents an audio stream. The AudioContext has a function, createMediaElementSource, which creates a sound source node that will re-route the element’s audio playback and stream it through the routing graph…
var audioElement = document.getElementById("player");
var source = context.createMediaElementSource(audioElement);
source.connect(context.destination);
One ‘gotcha’ that you may need to be aware of (depending on the status of issue 112368), is that the source and its connection may need to be created after the audio element is ready to play…
audioElement.addEventListener("canplay", function() {
    var source = context.createMediaElementSource(audioElement);
    source.connect(context.destination);
});
The AnalyserNode
So, now we have our streaming input coming into our routing graph and going straight to our audio hardware. But, how do we do the real-time analysis in order to make our music visualiser? Well I did say that the routing was really simple, so here it is…

The API provides a node that does it all for us - the AnalyserNode. All we need to do is create an AnalyserNode and stick it in the routing graph between our source and destination. When the AnalyserNode is used in a routing graph, the audio data is passed un-processed from input to output, but we can use the node object to access the frequency-domain and time-domain analysis data in real-time.
As you’d expect, an AnalyserNode can be created using the createAnalyser function on the AudioContext object…
var analyser = context.createAnalyser();And, to create the routing graph we simply insert the analyser between our streaming audio source and the destination…
audioElement.addEventListener("canplay", function() {
    var source = context.createMediaElementSource(audioElement);

    // Connect the output of the source to the input of the analyser
    source.connect(analyser);

    // Connect the output of the analyser to the destination
    analyser.connect(context.destination);
});
By default the analyser will give us frequency data with 1024 data points. We can change this by setting the fftSize property. The fftSize must be set to a power of two[2] and the number of data points in the resulting frequency analysis will always be fftSize/2. The frequencyBinCount property of the analyser will tell us the number of data points we’re going to get in the frequency data.
console.log(analyser.fftSize); // 2048 by default
console.log(analyser.frequencyBinCount); // will give us 1024 data points

analyser.fftSize = 64;
console.log(analyser.frequencyBinCount); // fftSize/2 = 32 data points
So, if we keep a byte array with frequencyBinCount elements, we can populate it with the frequency data at any time by passing it to the analyser’s getByteFrequencyData[3] function…
var frequencyData = new Uint8Array(analyser.frequencyBinCount);
analyser.getByteFrequencyData(frequencyData);
Creating the animation
The best way to use this real-time data to create and render an animation is to refresh our frequencyData in a requestAnimationFrame callback, and then use the new data to update the animation. requestAnimationFrame just schedules the function to be called again at the next appropriate time for an animation frame. It allows the browser to synchronize the animation updates with the redrawing of the screen (and possibly make some other optimisations based on CPU load, whether the page is currently in a background or foreground tab, etc).
function update() {
// Schedule the next update
requestAnimationFrame(update);
// Get the new frequency data
analyser.getByteFrequencyData(frequencyData);
// Update the visualisation
bars.each(function (index, bar) {
bar.style.height = frequencyData[index] + 'px';
});
};
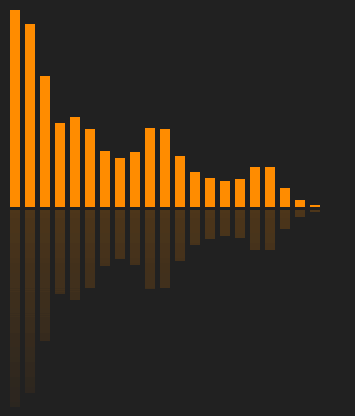
// Kick it off...
update();Here we’re simply using the frequency data to set the heights of some coloured ‘bars’. (The ‘bars’ are divs laid out horizontally with a fixed width and a dark orange background-colour.) Of course, just displaying the frequency data in a bar graph is the simplest (and least entertaining!) music visualisation but with a bit more imagination and creativity it should be possible to use this approach to create some much more interesting music visualisations.
Don’t forget to look through the final source code for our simple example.
1. FireFox has an alternative API which has been deprecated in favour of supporting the Web Audio API in the future.
2. I think the power of 2 restriction just allows it to use a more efficient FFT algorithm...but I've forgotten much of my signal processing studies now so don't quote me on that!
3. There is also a getByteTimeDomainData function for getting the current time-domain (waveform) data but our simple animation only uses the frequency data.
About
I work as a Software Developer at Nonlinear Dynamics Limited, a developer of proteomics and metabolomics software.
My day job mainly involves developing Windows desktop applications with C# .NET.
My hobby/spare-time development tends to focus on playing around with some different technologies (which, at the minute seems to be web application development with JavaScript).
It’s this hobby/spare-time development that you’re most likely to read about here.
Ian Reah